
Analytics is a module for the SmartFoxServer 2X Administration Tool which offers an unmatched business view over your multiplayer game / multiuser application, providing an insight into its usage from a demographical, technological and applicative perspective.
Analytics is an advanced reporting console allowing you to dive into usage data built around a number of metrics which mimic the classic website usage metrics (visits, unique visitors, etc) and new metrics specifically designed for multiuser environments.
Analytics offers data range comparison to better evaluate the benefits of actions performed to improve the game / application, or the impact of marketing campaigns.
Analytics is also an invaluable companion for developers as a tool to analyze the clients behavior after a load test, or to get an immediate picture of errors and warnings by means of a dedicated view.
Features

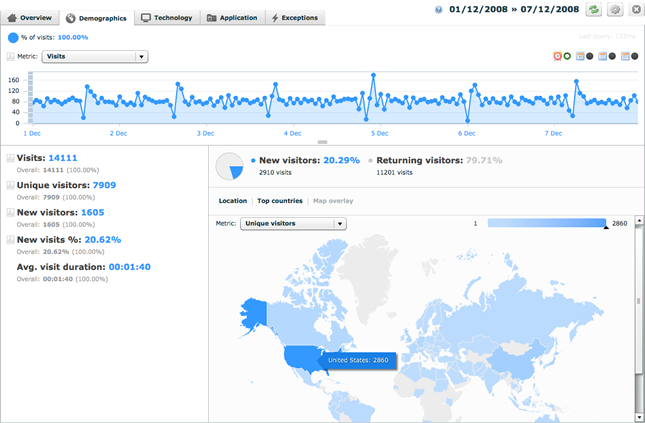
[metrics] Analytics provides more than 20 metrics offering a complete view on the game/application usage. They include: total visits, unique visitors, new and returning visitors, % of new visits, average visit duration, average and peak concurrent users, Rooms created, average Room duration, Room joins per visitor, number of exceptions and more.
Special highlight has been given to new and returning visitors through a dedicated pie chart.
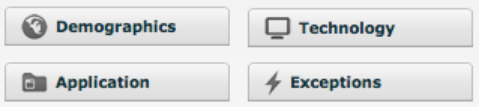
[views] Other than the starting overview dashboard, Analytics provides four specialized views over the data, with dedicated charts.
Under Demographics visitors are split by country, under Technology they are split by client platform and version, under Application by server Zone. Additionally the Exception tab offers an overall view on errors and warnings logged by the server.
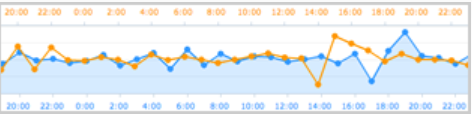
[trend] The main chart in each view shows the selected metric trend over the course of the selected period. If range comparison is active, another series is displayed above the main one. Data can be aggregated by hour, day, week or month.
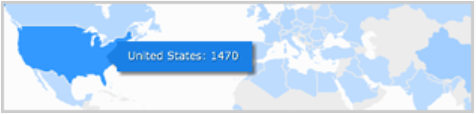
[geolocation] Under the Demographics view visits-related metrics can be split by country through the geolocation of client IP addresses. Click on a country to filter data, compare to overall values and display the trend in the main chart.
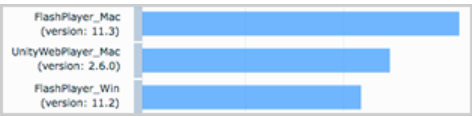
[ranking] All specialized views show dedicated bar charts providing the ranking of the related entity (for example the client platform) for the selected metric. Click on a bar to filter data, compare to overall values and display the trend in the main chart.
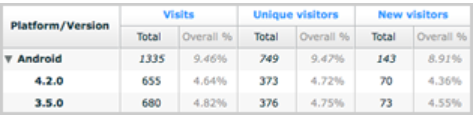
[datagrid] All specialized views provide datagrids showing the main metrics split by the related entity (for example the client platform/version), with percentages with respect to the overall value and drill down capabilities where available. Click on a row to filter data and display the trend in the main chart.
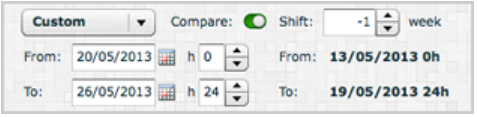
[range] Select the data range among predefined options (today, yesterday, last week, last month) or chose a custom range down to a specific hour of the day. Comparing two temporal ranges is just a matter of shifting back the selected time period.
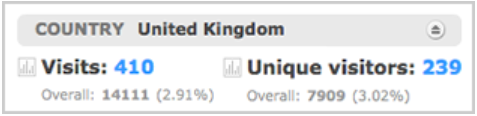
[filter] In the specialized views, click on an entity (a country for example) to filter data, get the percentage value with respect to the overall metric value and display the specific trend of the metric in the main chart.
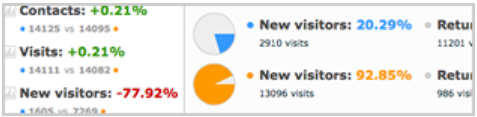
[compare] When tho time periods are selected, the main chart, the metrics list and the new visitors pie charts show the values side-by-side for camparison. The metrics list also show the change in percentage for an immediate feedback on targeted actions like a marketing campaign.
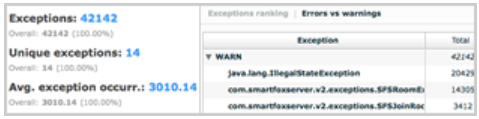
[exceptions] The Exception view shows the number of total and unique exceptions occurred in the selected period, differentiating between warnings and errors. A pie chart is also available showing the percentage of warnings and errors over the total exceptions.
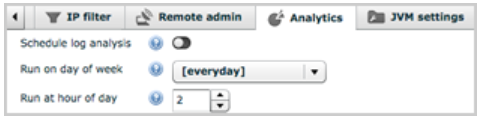
[schedule] By means of a dedicated tab in the AdminTool's Server Configurator module it is possible to schedule the automatic processing of SmartFoxServer 2X to collect Analytics data.
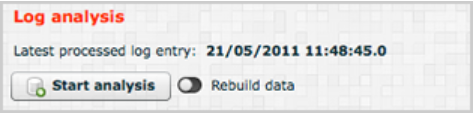
[analysis] Logs analytics can be launched from within Analytics itself too, to process new data and keep an eye on what is going on on the server almost in realtime.